Exponential Decay
Exponential Decay
Graph an Exponential Decay
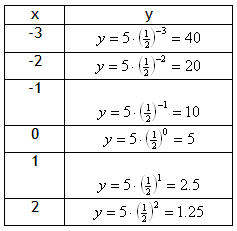
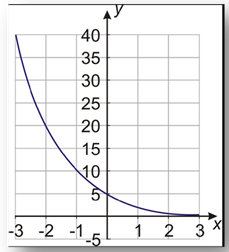
The graph of an exponential decay function will always take the same basic shape as the one in the previous example. It will decrease quickly in the beginning and then slower and slower. One way to make a graph of an exponential function is to make a table of values and plot points.
Example Graph the exponential function ![]()
Step 1. Make a table of values.

Step 2: Graph the function by plotting points.
