Exponential Decay
| Site: | Gladwin |
| Course: | Michigan Algebra I Sept. 2012 |
| Book: | Exponential Decay |
| Printed by: | Guest user |
| Date: | Monday, February 2, 2026, 7:33 PM |
Description
Exponential Decay
Introduction
In this section, we are going to look at exponentially decreasing functions. An example of such a function is a quantity that gets decreased by one half each time. These functions are exponential decay functions.
Example 1
Nadia devised a clever plan. She will always eat half of the candy that is left in the bag each day. She thinks that she will get candy every day and her candy will never run out. How much candy does Nadia have at the end of the week? Would the candy really last forever?
Step 1. Determine the initial value.
Since the first day she had 160 pieces of candy, the initial value is 160.
Step 2. Determine the decay factor.
Since she is eating half the candy every day, it is being multiplied by 0.5 each day. Therefore, the decay factor is 0.5.
Step 3. Write an exponential function.
The general form of an exponential function is ![]() .
.
For this situation, the equation is ![]() .
.
Continued
Since there are 7 days in a week, use 7 as the exponent.
![]()
At the end of the week, she will have 1.25 pieces of candy left.
Step 5. Graph the candy problem function. Use the graph to answer the final question.
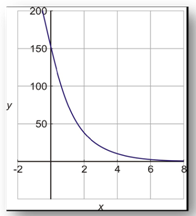
Will Nadia's candy last forever? Notice that the graph never really gets to zero, this is due to the asymptotic behavior of exponentials discussed in previous lessons. Theoretically there will always be some candy left, but she will be eating very tiny fractions of one piece of candy every day after the first week.
Graph an Exponential Decay
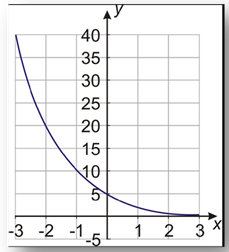
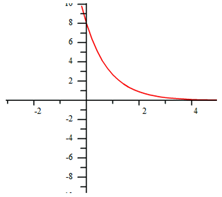
The graph of an exponential decay function will always take the same basic shape as the one in the previous example. It will decrease quickly in the beginning and then slower and slower. One way to make a graph of an exponential function is to make a table of values and plot points.
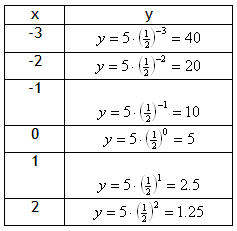
Example Graph the exponential function ![]()
Step 1. Make a table of values.
Negative Reciprocal
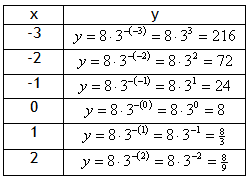
Example Graph the exponential function y = 8 · 3?x.
Step 1. Make a table of values.
Growth vs. Decay
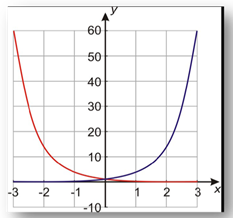
Example Graph the functions y = 4x and y = 4?x on the same coordinate axes.
Step 1. Make a table of values.
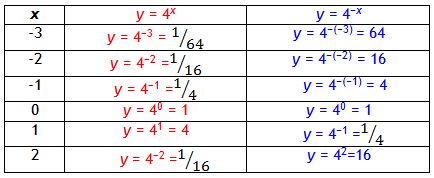
*Note: The values of these two functions are reciprocals of each other.
Step 2. Graph the function by plotting points.
Application
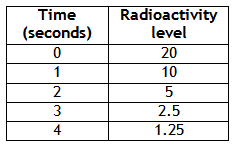
Example 1Â A radioactive substance has a half-life of one week. In other words, at the end of every week the level of radioactivity is half of its value at the beginning of the week. The initial level of radioactivity is 20 counts per second.
a) Draw the graph of the amount of radioactivity versus the time in weeks.
b) Find the formula that gives the radioactivity in terms of time.
c) Find the radioactivity left after three weeks
Step 1. Make a table of values to represent the function.
 Â
 Step 2. Plot the points to make a graph.
 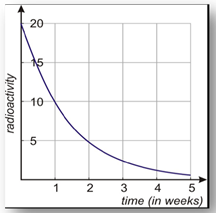
Example 1 Continued
Remember that the general formula for an exponential function is ![]()
a is the initial value, so a = 20.
b is the common ratio, so b = 1/2.
Therefore, the equation is ![]()
Step 4. Determine the amount of radioactivity left after three weeks.
Since x represents the number of weeks, let x = 3.
Example 2
a) Draw the graph of the car's value versus the time in years.
b) Find the formula that gives the value of the car in terms of time.
c) Find the value of the car when it is four years old.
Step 1. Make a table of values to represent the function.
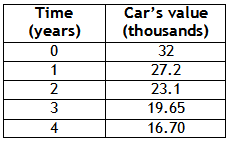
Step 2. Plot the points to make a graph.
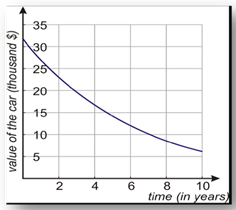
Step 3. Write a model for the exponential decay.
Remember that the general formula for an exponential function is ![]()
a is the initial value, so a = 32,000.
Since the car is decreasing from 100% at a rate of 15%, b = 100%-15% = 85% = 0.85.
Therefore, the equation is ![]()
Step 4. Determine the value of the car after four years.
Since x represents the number of years, let x = 4.
Video Lessons
To learn how to determine the formula and solution to exponential decay, select the following links:
Exponential Decay #1
Exponential Decay #2Â
Exponential Decay
Guided Practice
Guided Practice
Practice
Answer Key
Sources
Embracing Mathematics, Assessment & Technology in High Schools; A Michigan Mathematics & Science Partnership Grant Project
Gloag, Anne & Andrew. "Exponential Functions." February 24,
2010.http://www.ck12.org/flexr/chapter/4478
Holt, Rinehart, & Winston. "Exponential & Logarithmic Functions."
http://my.hrw.com/math06_07/nsmedia/homework_help/alg2/alg2_ch07_01_homeworkhelp.html (accessed September 10, 2010).
