Graphing
Functions Where p = 1 or p = 0
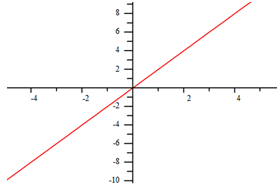
When p = 1, the graph will be a line. Since the highest degree exponent is 1, the equation is linear and holds all properties of linear functions.
The graph below represents the function, ![]() .
.

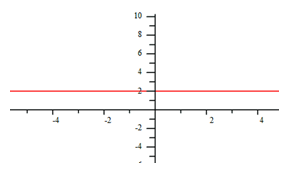
When p = 0, the graph will be a horizontal line. Since x0 = 1, the equation will be constant with no rate of change.
The graph below represents the function, ![]()
